An insurer since 1906
The Standard provides disability, life, dental and vision insurance, absence management and retirement plans to employers and individuals.
 Information architecture → design → shipped8 min read
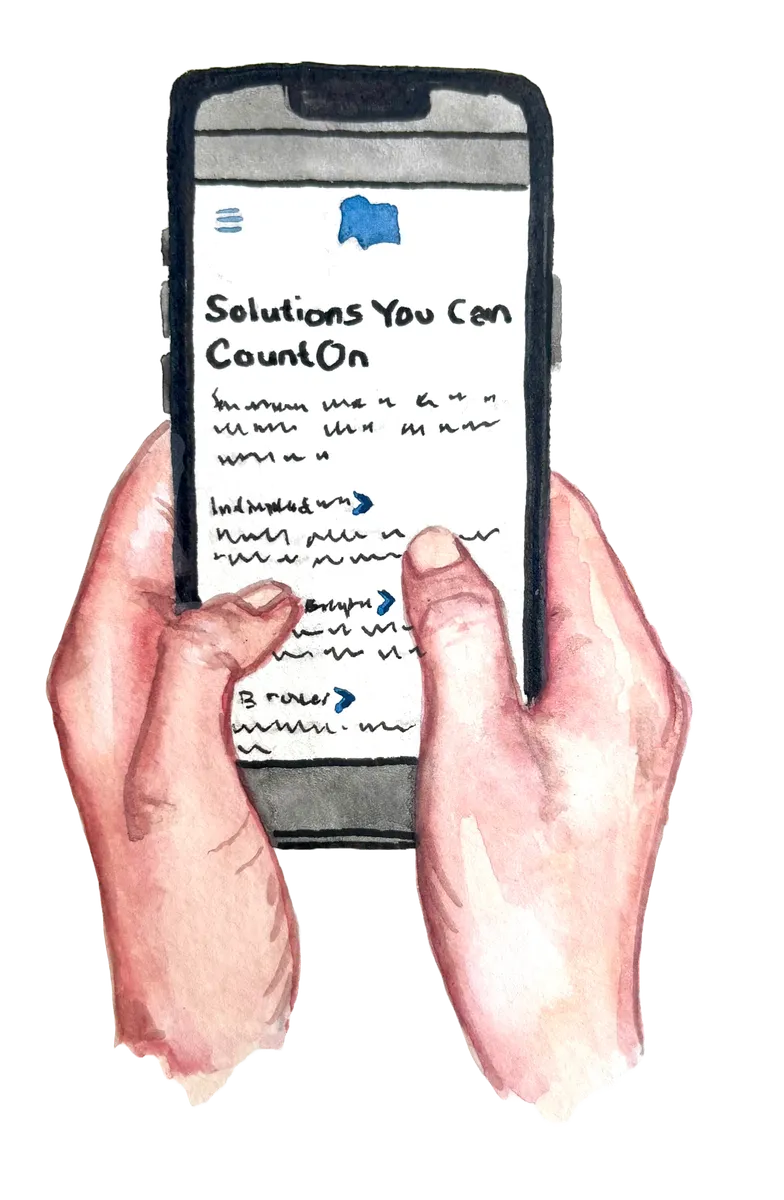
No budget for user research, stakeholders asking “what do the users think?” And a mobile-first redesign that’s live today because I went and found out.
Context
The company and the stakes
The Standard provides disability, life, dental and vision insurance, absence management and retirement plans to employers and individuals.
Employees look for their benefits, employers manage plans for their teams, and brokers sell The Standard’s products to clients. They all start at standard.com.
The site had to move to a new platform and meet accessibility standards anyway. That made it the moment to fix how people found their way.
At a glance
Assumptions → evidence
Oct–Dec 2022 · two-week sprints
01 · Discover
The real problem
One website was trying to serve three distinct audiences (employees, employers and brokers), and none of them could find their way.
No budget for user research in discovery. I’d have to start from stakeholder knowledge, analytics and competitors, and prove every assumption later.
I ranked 13 insurers on the seven tasks that mattered most. The Standard sat near the bottom for navigation and login and the best-in-class patterns became my starting points.
Pattern I borrowedNavigation segmented by audience, with clear drop-down subcategories that don’t overwhelm.
Pattern I borrowedPick your role or topic, then get the right phone numbers, links and forms, all scannable.
Pattern I borrowedA simple results page that shows the result count and filters to narrow it down.
Pattern I borrowedOne step per page, with what you’ll need listed up front.
Pattern I borrowedChoose your audience after clicking Log In, from a link that’s clearly site-wide.
Without users to interview, I mapped three journeys from stakeholder knowledge and labeled them for what they were, assumptions to test. Each one bottomed out in the same place, with people not knowing where to go.
02 · Structure
Information architecture
The old site mixed audiences everywhere. There were two near-identical retirement pages, two near-identical workplace-benefits pages, and an “I want to…” section that duplicated both. I reorganized everything around three audience doorways, with a repeatable pattern inside each.
When I presented the first IA, stakeholders got uneasy. They had one question.
“What do the users think?”
Don’t argue. Test. I proposed three tree tests, one per audience. They were fast, cheap, and the most direct way to answer it with evidence.
I also added check-ins so stakeholders saw progress, not just a final answer.
Instead of guessing at fixes, I carried every open question into usability testing. Stakeholders regained confidence once they saw the IA hold up with real users.
03 · Design
Sketches → wireframes
I started on paper, testing how long labels could get before a navigation row broke, and how one homepage could welcome three audiences without confusing any of them. Then I built 25+ wireframe pages in Figma for the visual designer to bring to life.
Each audience gets a doorway right under the hero, so people self-select in one click.
↳ Answers “Who is this site for?”Audience tabs with their own sub-menus, plus a persistent “Get in Touch” in every one.
↳ Answers “I can’t find how to contact you”Choose your role and topic, and only the contact options that apply to you appear.
↳ Answers “Which number do I call?”Recent searches, sorting, filters and tags to narrow results fast.
↳ 23% refined searches · 13% exitedA guided flow that asks your coverage and role, with forms one click away.
↳ Self-service for the top taskKeyword search, a state filter and form-type filters across hundreds of forms.
↳ Self-service for the top taskTop tasks like dental login, filing a claim, reporting an absence or finding a form are one tap away.
↳ Employees mostly visit to log in or actFewer pages, with more on one landing page, moved where people looked for it.
↳ Tree test showed Careers was buried04 · Test
Dec 12–16, 2022
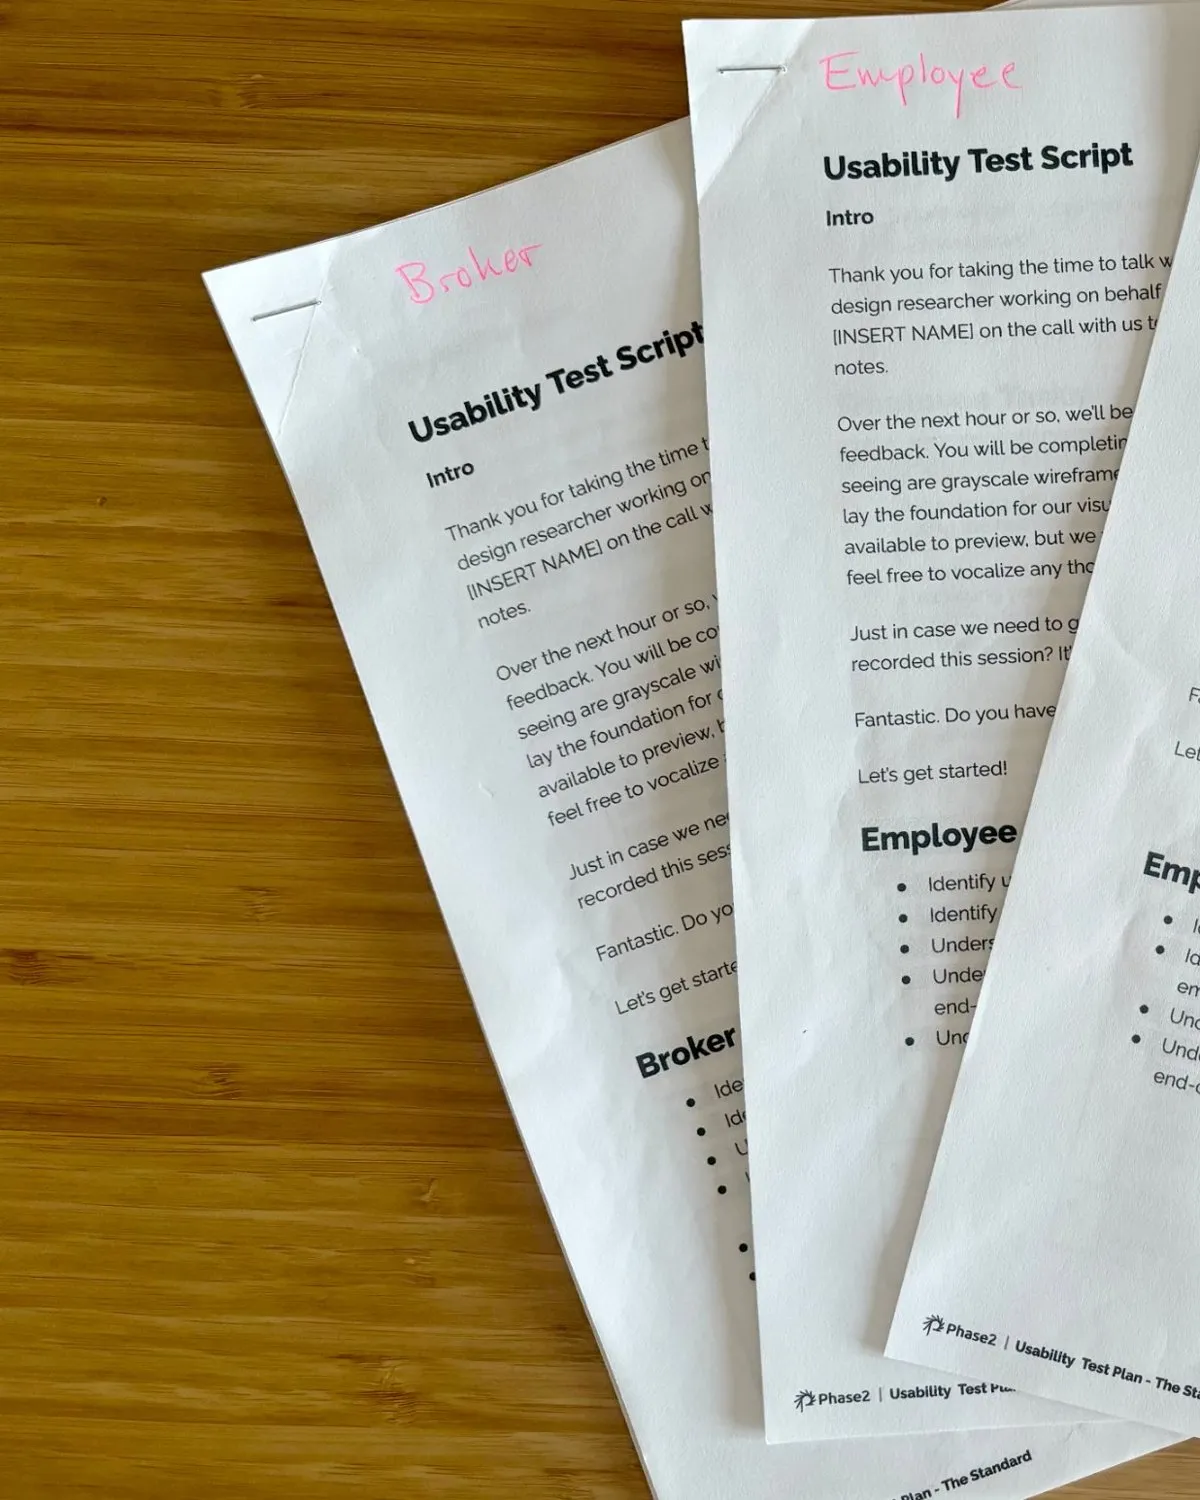
I moderated all 15 one-hour usability tests over Zoom, 4 employers, 4 employees and 7 brokers each with its own discussion guide, working through a clickable low-fidelity prototype.
“Tell me you have the most providers, the best rates, the details of how you’re going to help me do business with you.”
“This website is a one-stop shop for employers.”
“It’s easy to use. Easy to find things without any trouble.”
The homepage quick links were mine, and employees loved them. But employers and brokers read them as a sign the page wasn’t for them. I cut them.
05 · Shipped
Research → live
Every finding followed the same path. Spotted in the tree test, confirmed in usability, shipped to the live site. Pick one to trace it.
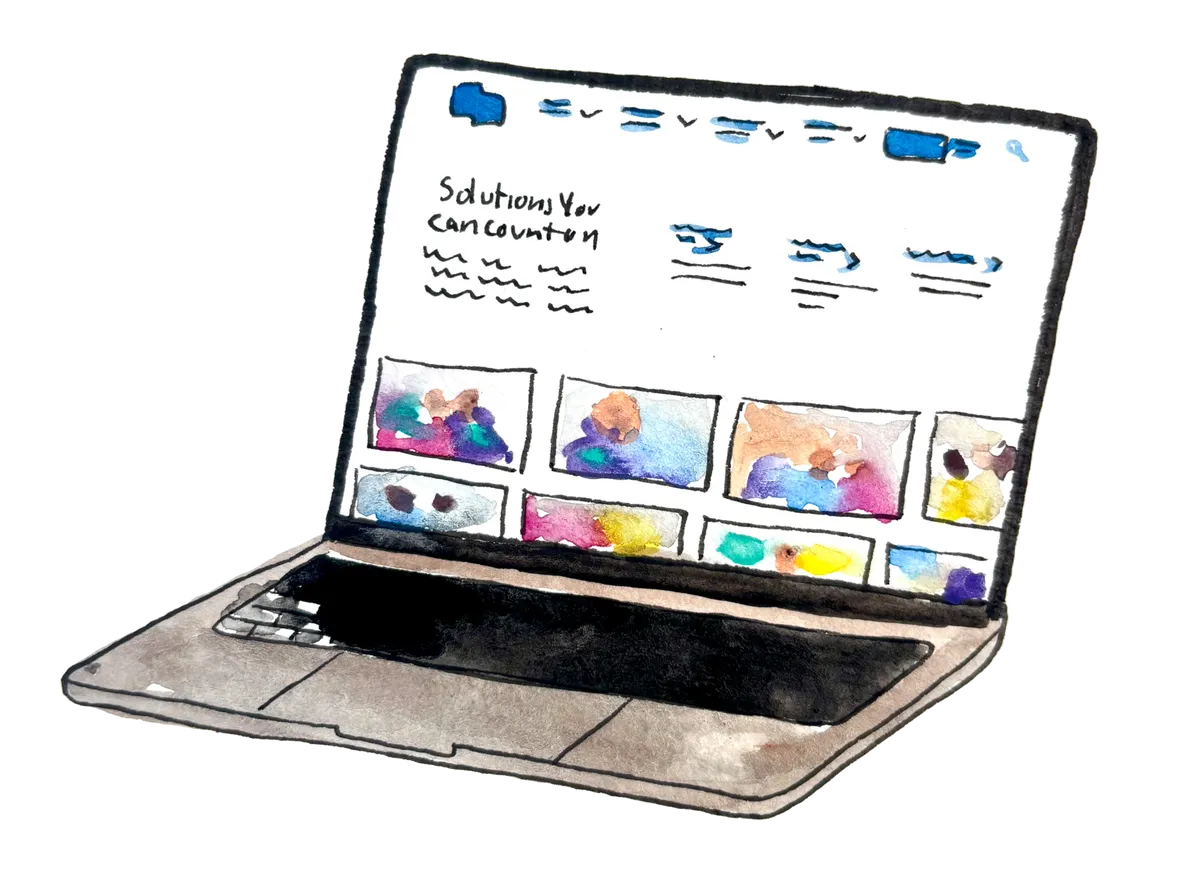
Don’t take my word for it. The structure is live.
Visit standard.com ↗06 · Reflect
Looking back
Even five quick interviews in discovery would have turned my journey-map hypotheses into evidence weeks sooner and spared stakeholders the uneasy moment.
With no conversion tracking, I couldn’t prove the lift. Today I’d push for baselines (search exits, task success) before launch, not after.
I synthesized 15 sessions by hand in a week. AI-assisted tagging would get me to themes in hours, leaving more time for a second round of testing.